Tanks without monitors can be difficult to forecast, especially when they’re slow-moving or have unpredictable usage patterns. Implementing tank forecasting can improve delivery efficiency by 30% by increasing drop sizes and placing orders to achieve higher tank fill efficiency.
BizSpeed can forecast and monitor ALL tanks

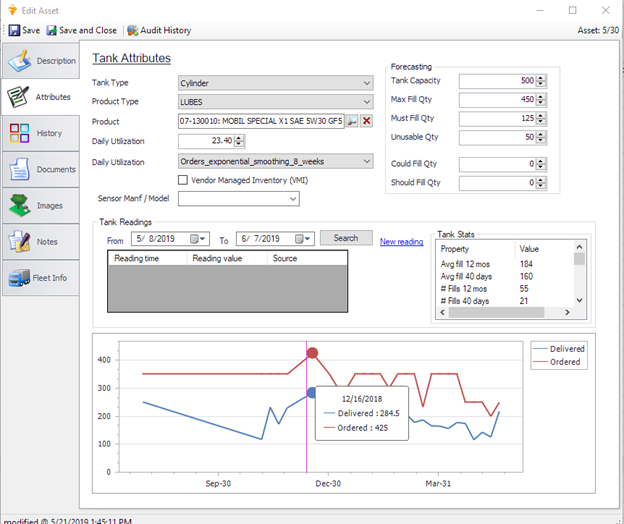
Tank level monitoring allows for more innovative and accurate forecasting, enabling better decision-making when it comes to replenishment orders. In the graphic above, the tank monitors display typical keep-full tank data using level sensors. The red line represents order quantity, while the blue like indicates the amount delivered. The non-monitored tank shows a 30% variance in delivery compared to the ordered amount.
Benefits of Tank Forecasting
Smarter forecasting using a tank monitoring system offers numerous advantages:
- increases drop size
- reduces miles driven
- maximizes the capacity utilization of delivery trucks
The statistics below show a positive impact of forecasting:

Data Capture with goRoam Mobile App
BizSpeed’s goRoam mobile app captures a significant amount of delivery data. Tanks are barcoded, and drivers have the option to record tank readings before and after delivery. By transmitting data quickly via cellular networks, the app helps build an accurate tank database, verifying attributes such as tank readings and whether the tank was delivered in full.
BizSpeed provides customers with various fuel tank monitoring system reports to facilitate efficient fuel tank monitoring. These reports cover factors such as ordered vs. delivered variance by product, customer, and tank.
We’re using machine learning to forecast tanks based on a combination of the following:
- Accurate Delivery history
- Stick readings access
- Related tanks with monitors
- Related products
Tank Forecasting as a Subscription
Through our subscription-based forecasting service, we offer significantly improved predictions of fuel usage trends. This optimization enables more efficient delivery frequency and volume for bulk tanks, resulting in increased average profit for tanks with recurring deliveries and allows for delivering more orders with an existing fleet. Our telemetry equipment provides complete visibility of stored fuel quantities, offering valuable insights to prevent system downtime and maintain control over oil and gas storage.
For existing customers, we have significant delivery history data, allowing us to conduct studies that determine which tanks require monitor installations and which ones can be forecasted based on order history alone. If you have a significant amount of non-monitored tanks, reach out to us and we can demonstrate how smarter tank forecasting and monitoring can aid decision-making and understanding of tank-level data.
Key Metrics Provided by Data Analytics Hardware
By installing our Data Analytics hardware for bulk storage tanks, you gain access to essential tank monitoring metrics, including:
- Average delivery quantity in the last 12 months
- Average service delivery quantity in the last 40 days
- Minimum & maximum delivery quantities in the last 12 months and 40 days
- Standard reporting of delivery quantity deviation in the last 12 months
The screenshot below shows an example of tank monitoring and the ordered vs. delivered graph.
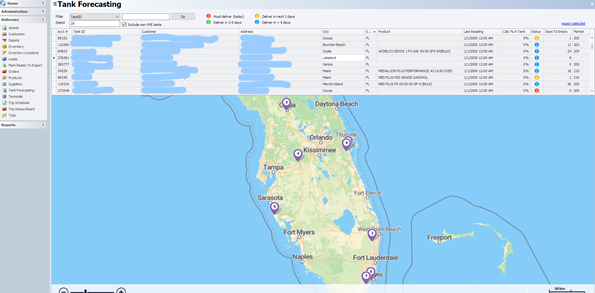
Tank Monitoring and Order Generation
Our forecasting engine and tank portal offer a solution for locating reliable tanks based on traits such as product locations, IDs, markets, and nearest tanks. This enables you to monitor current tank levels, estimate days to empty, track the percentage of fullness, and access other crucial power data. To help fill up a truck, you can use the portal to monitor and access facility locations of nearby tanks with the same product so you use 100% of your truck capacity.
We want to talk to you! We’ll show you the future of tank forecasting and remote tank monitoring. Let’s discuss how reliable forecasting tools and location monitoring software can improve your bottom line and customer satisfaction. Call to schedule a time to evaluate your tank delivery through BizSpeed’s Tank Forecasting.